Your data is never shared or used to train models
Inventory report
Sales report
Purchase suggestion
Supplier performance
Already have your ERP report at hand?
Pick the report, see where to find it in the menu, and upload the file.
See all reportsSee what Sykros delivers from your report
From the file exported by your ERP to a complete diagnosis, with charts, alerts and an action plan.
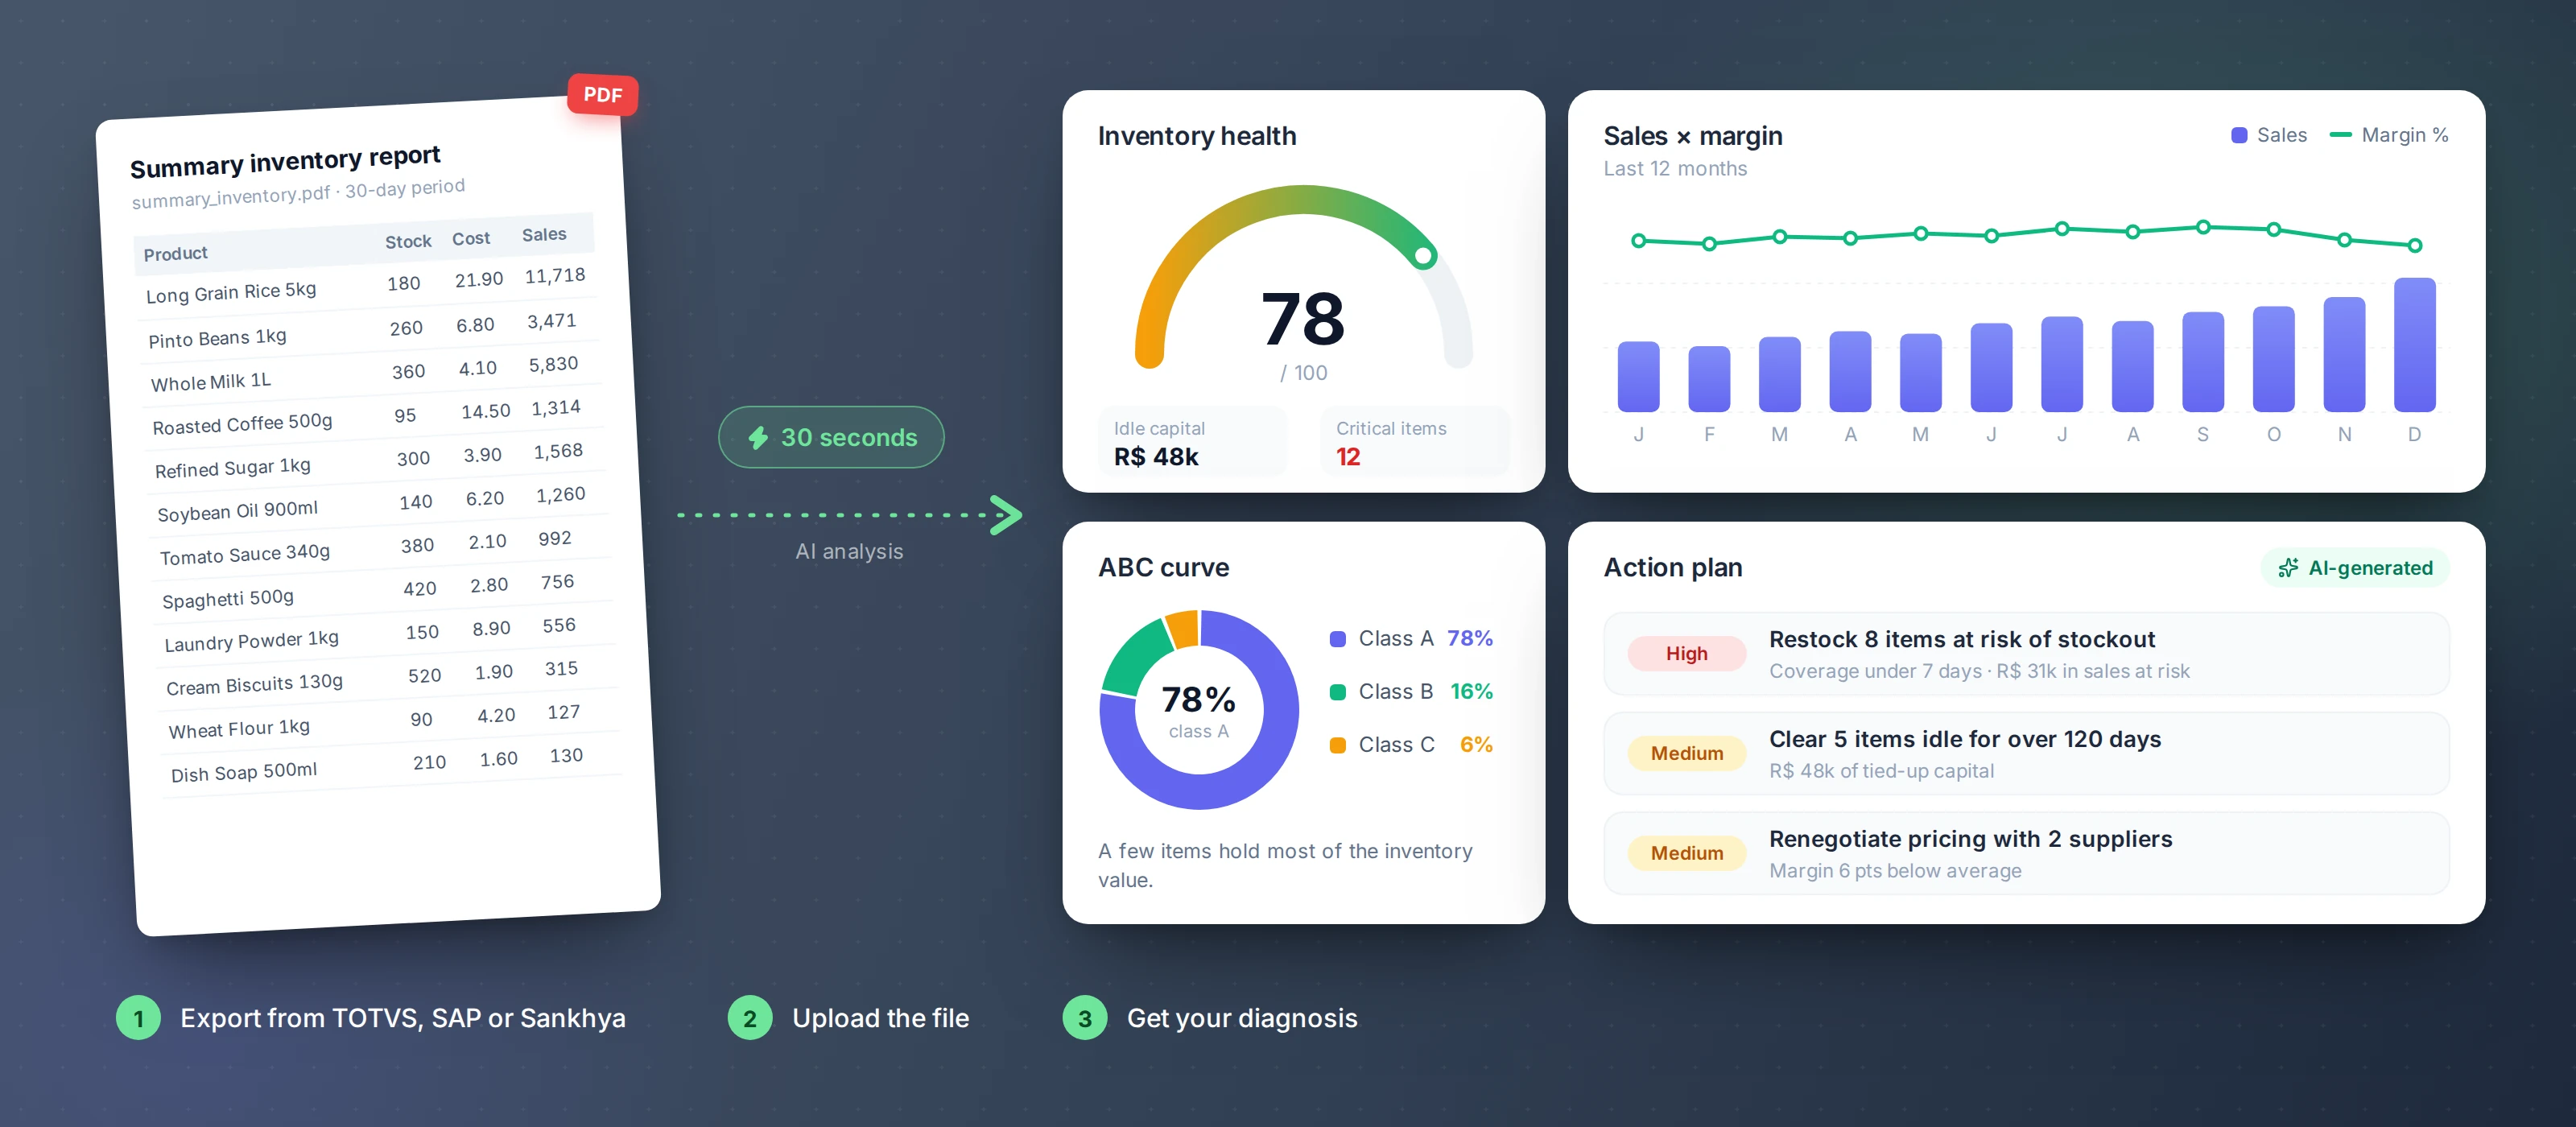
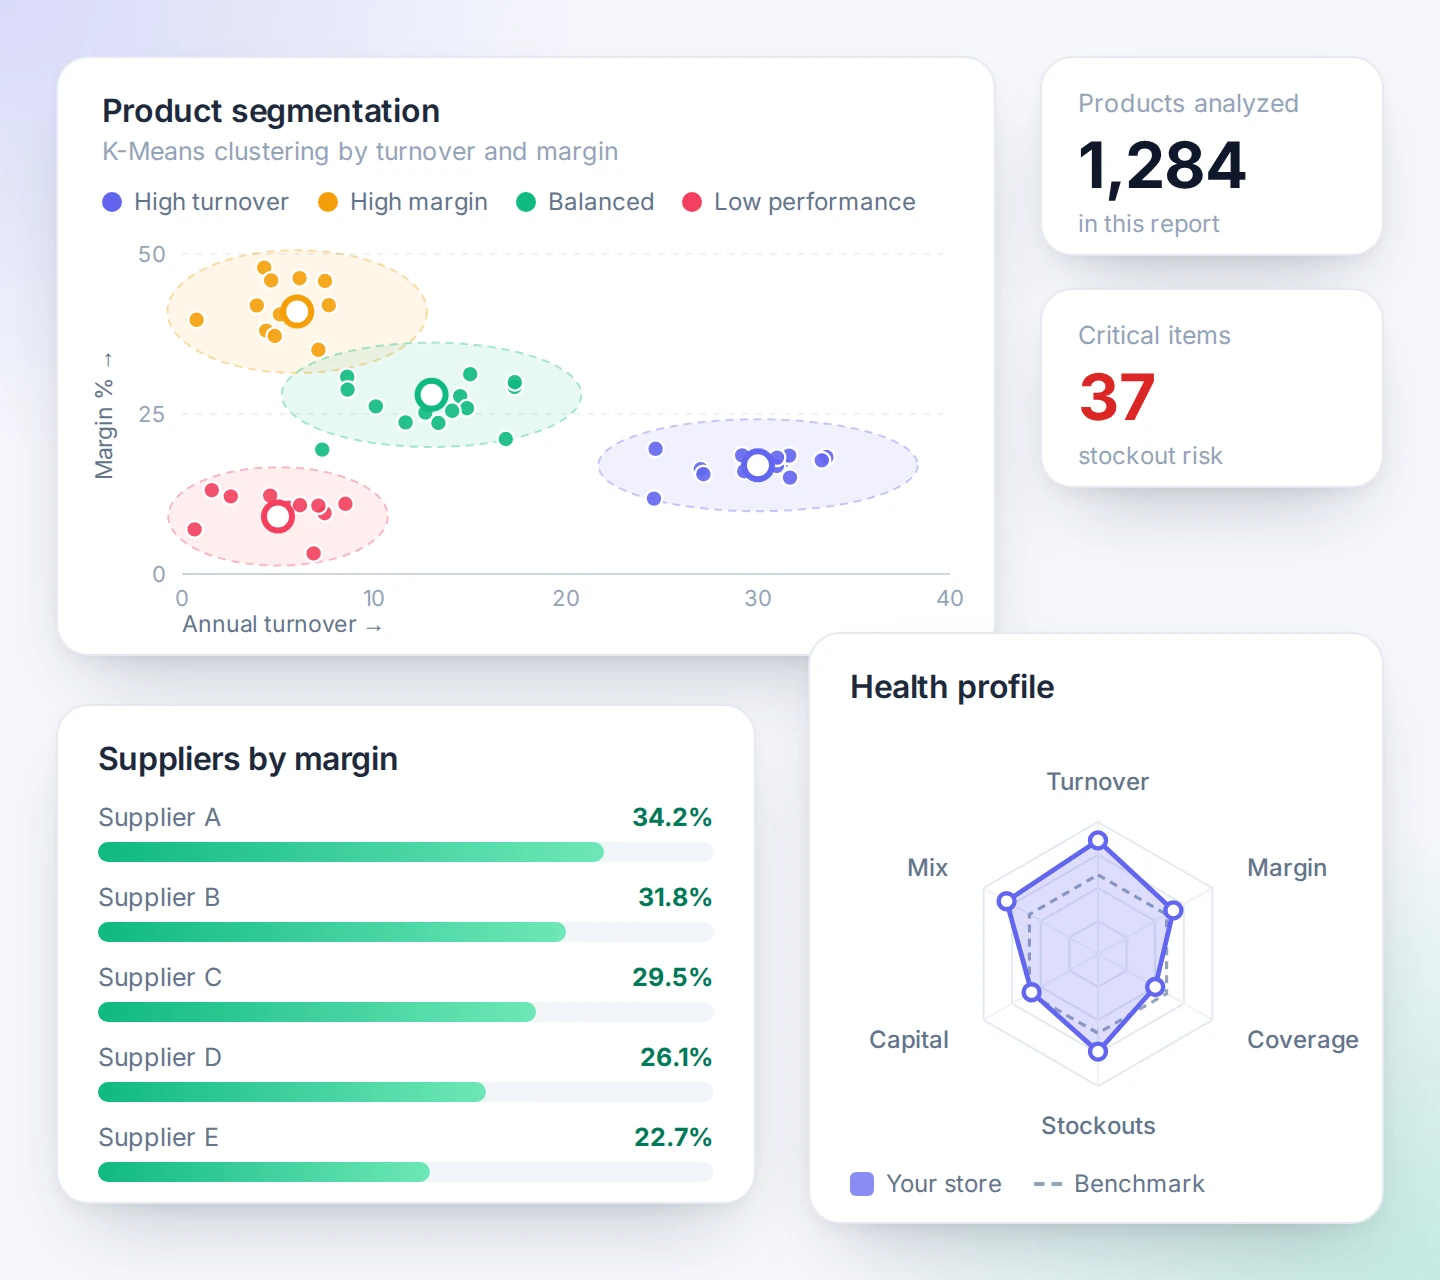
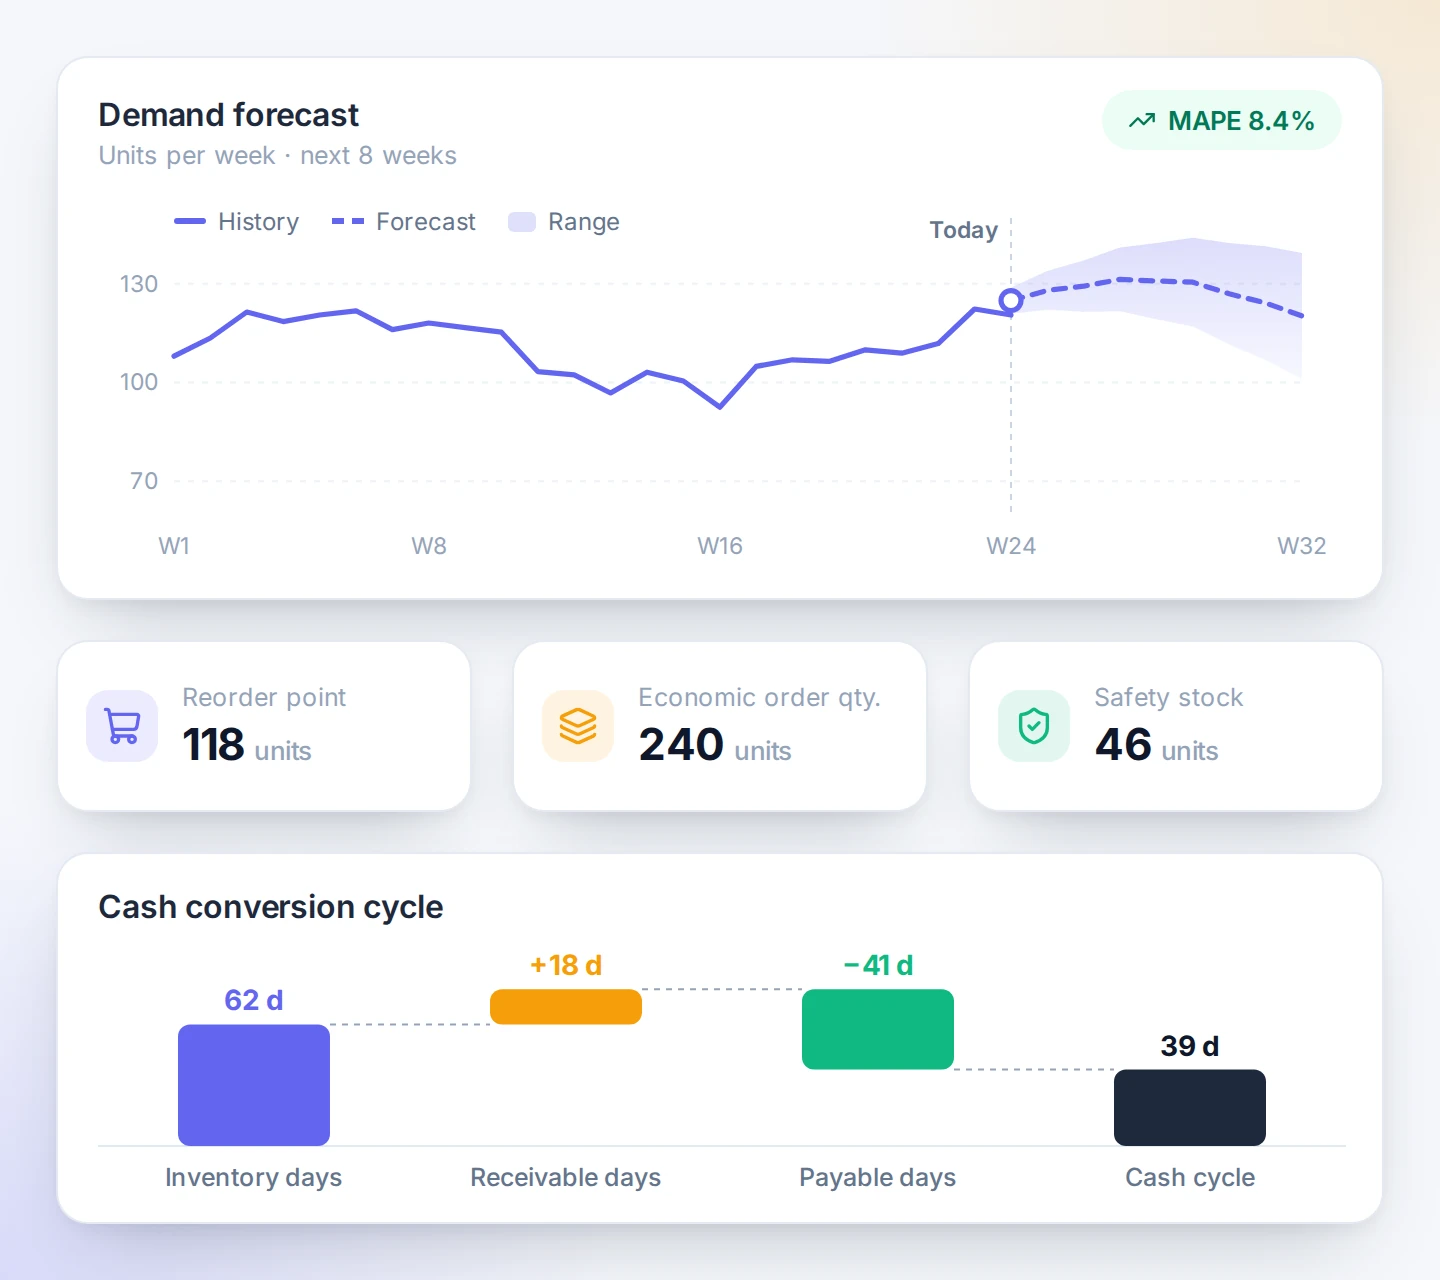
Illustrative images with fictitious data.
Margin × Turnover
Inventory report
Stock health,
seen instantly.
Upload your inventory spreadsheet and get a full diagnosis — which products are at risk, which are stalled, and where your margins are bleeding.
- Identifies critical products and rupture risk
- Detects negative stock and stalled items
- Margin and score ranking per product
- AI-generated action plan with priorities
Sales report
Sales trends,
clear as a chart.
Upload your monthly sales data and instantly see which products are growing, which are declining, and where your revenue is concentrated.
- Monthly and weekly trend analysis
- Top and bottom performing products
- Revenue and volume comparison
- AI-generated growth opportunities
12-month trend
Coverage in days
Purchase suggestion
Buy smarter,
not more.
Get a prioritized list of what to reorder, when, and how much — based on your actual sales velocity and stock coverage.
- Reorder list ranked by urgency
- Suggested quantities based on sales velocity
- Coverage in days per product
- Avoids overstocking and stockouts
Supplier performance
Know your suppliers,
inside out.
Evaluate each supplier by margin, volume, and reliability — and find out where you're exposed to risk or leaving money on the table.
- Ranking by margin and delivered volume
- Single-supplier dependency alerts
- Renegotiation and diversification suggestions
- AI-generated supplier scorecard
Risk × Return
Latest Posts



The insights and metrics presented by Sykros are generated from the data you upload, with support from third-party artificial intelligence models (Groq, OpenAI, and Anthropic) for processing and analysis. These models are used to detect schema, classify report columns, identify reporting periods, and recommend the charts most relevant to your data. Sykros does not replace the guidance of an accountant, management consultant, or supply chain specialist, and business decisions made based on these analyses remain the sole responsibility of the user. We recommend treating every metric as a starting point for further investigation rather than a final answer.
Results may vary depending on the quality, completeness, and format of the uploaded data. Reports coming from different ERPs (TOTVS, SAP, Sankhya) go through automatic normalization and column mapping before analysis, which may produce small divergences from the original data, particularly when reports contain incomplete periods, mixed currencies, or non-standard formatting. Whenever the platform is not confident about how a column should be interpreted, you will be asked to confirm or correct the mapping before the analysis is generated, so the final numbers reflect your actual business context.
Sykros is a decision-support analytics tool — not a financial, accounting, or tax audit. Metrics such as GMROI, turnover, fill rate, and reorder points are calculated using standard inventory-management formulas applied to the data you provide, and they are only as accurate as that underlying data. Always cross-check critical figures against your source systems before using them for pricing, purchasing, or reporting decisions with material financial impact.
Who we are
Sykros was built to simplify inventory and purchasing management for retail businesses that rely on ERP systems but lack the time or tooling to turn raw exports into clear, actionable decisions. Instead of manually building spreadsheets from PDF or CSV reports every month, you upload the file and Sykros handles the parsing, the calculations, and the visualization — surfacing what needs attention, whether that's slow-moving stock, understocked bestsellers, or a margin trend worth a closer look. Our goal is to give small and mid-sized retailers the same level of inventory intelligence that larger companies build in-house, without requiring a data team to maintain it.